The primary weather producer in the middle latitudes (for our purposes, the
region between southern Florida and Alaska, essentially the area of the westerlies)
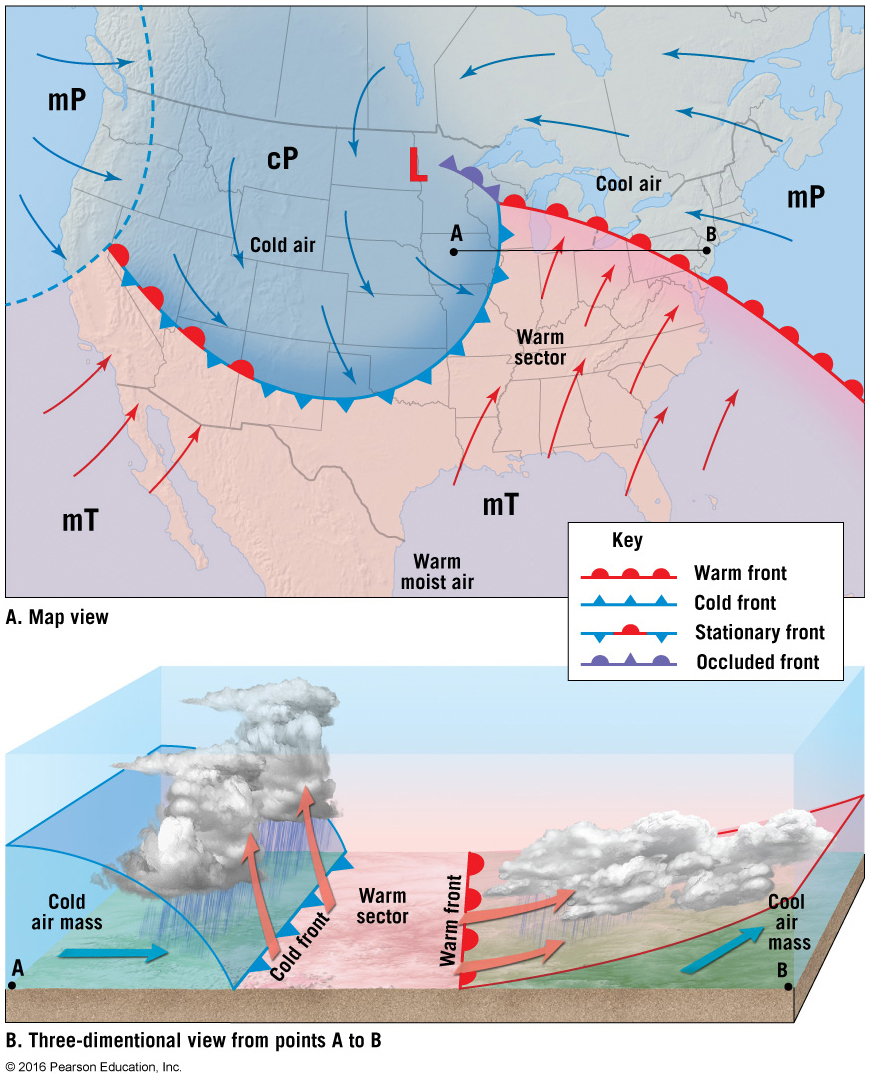
is the middle-latitude or midlatitude cyclone. Middle-latitude cyclones are
large low pressure systems with diameters often exceeding 1000 kilometers (600
miles) that generally travel from west to east. They last a few days to more
than a week, have a counterclockwise circulation pattern with a flow inward
toward their centers, and have a cold front and frequently a warm front extending
from the central area of low pressure. In the polar front theory, (also called
the Norwegian cyclone model), wave cyclones develop in conjunction with the
polar front.
Power Point Presentations VERY IMPORTANT!!!!!!* TEST 4 - MAY 6TH - IF YOU HAVE ANY QUESTION ON THE CHAPTERS PLEASE EMAIL ME -- PLEASE REACH OUT..
**** THE EXAM IS DURING YOUR CLASS TIME AND CLASS TIME ONLY - VERY IMPORTANT!!!!!!*****If you miss an exam - your final exam grade will replace the missed exam!!!!!
TEST 4 - MAY 6TH - TEST 4 (Chapters 9-10-11) VERY IMPORTANT!!!!!!*****If you miss an exam - your final exam grade will replace the missed exam!!!!!
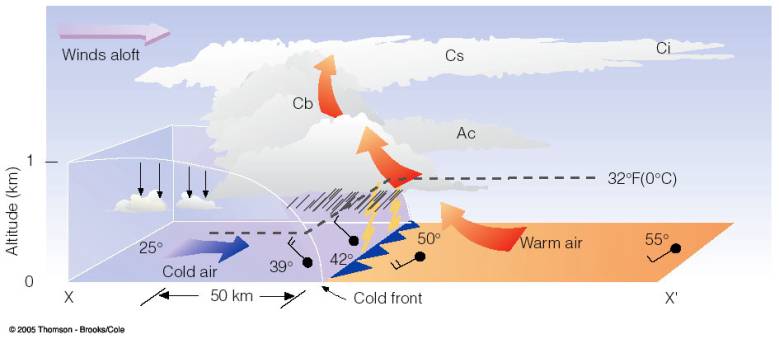
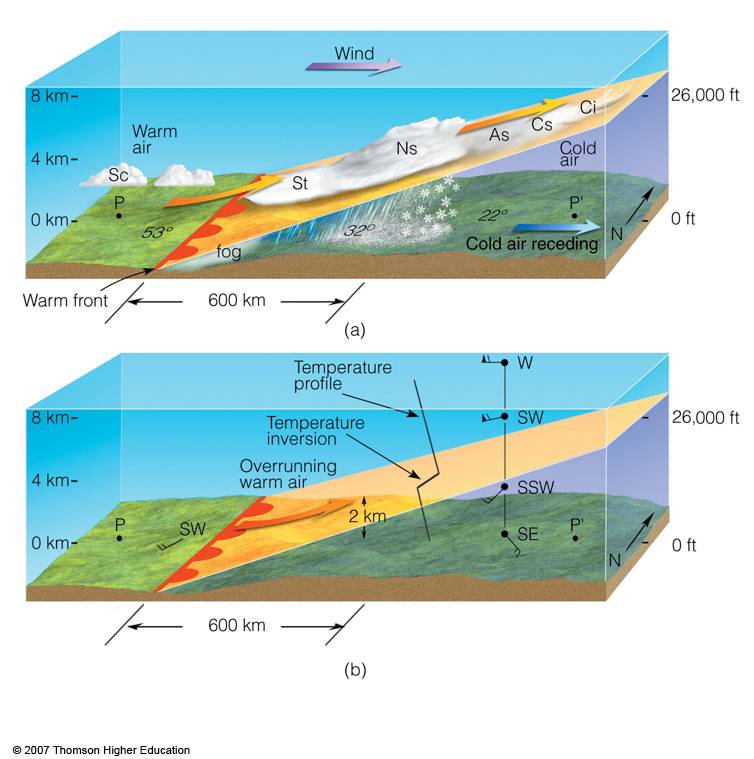
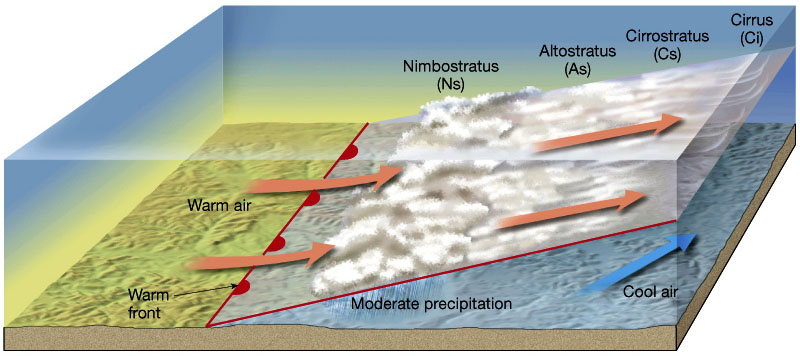
Remember Frontal Wedging from Chapter 4 -- Air Rises - Condensation leads to Clouds and Precipitation
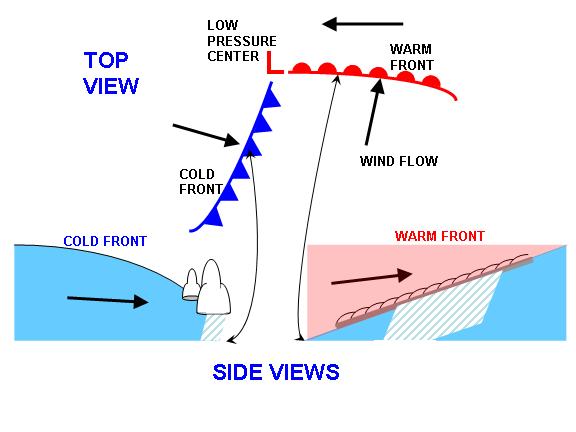
Wind Direction is always the direction the wind is coming from.
Very Important - Understanding your location to the storm center (Low Pressure)
Fronts are boundary surfaces that separate air masses of different densities,
one usually warmer and more moist than the other. As one air mass moves into
another, the warmer, less dense air mass is forced aloft in a process referred
to as overrunning.
Notice the color - size and shape of the fronts. The
five types of fronts are
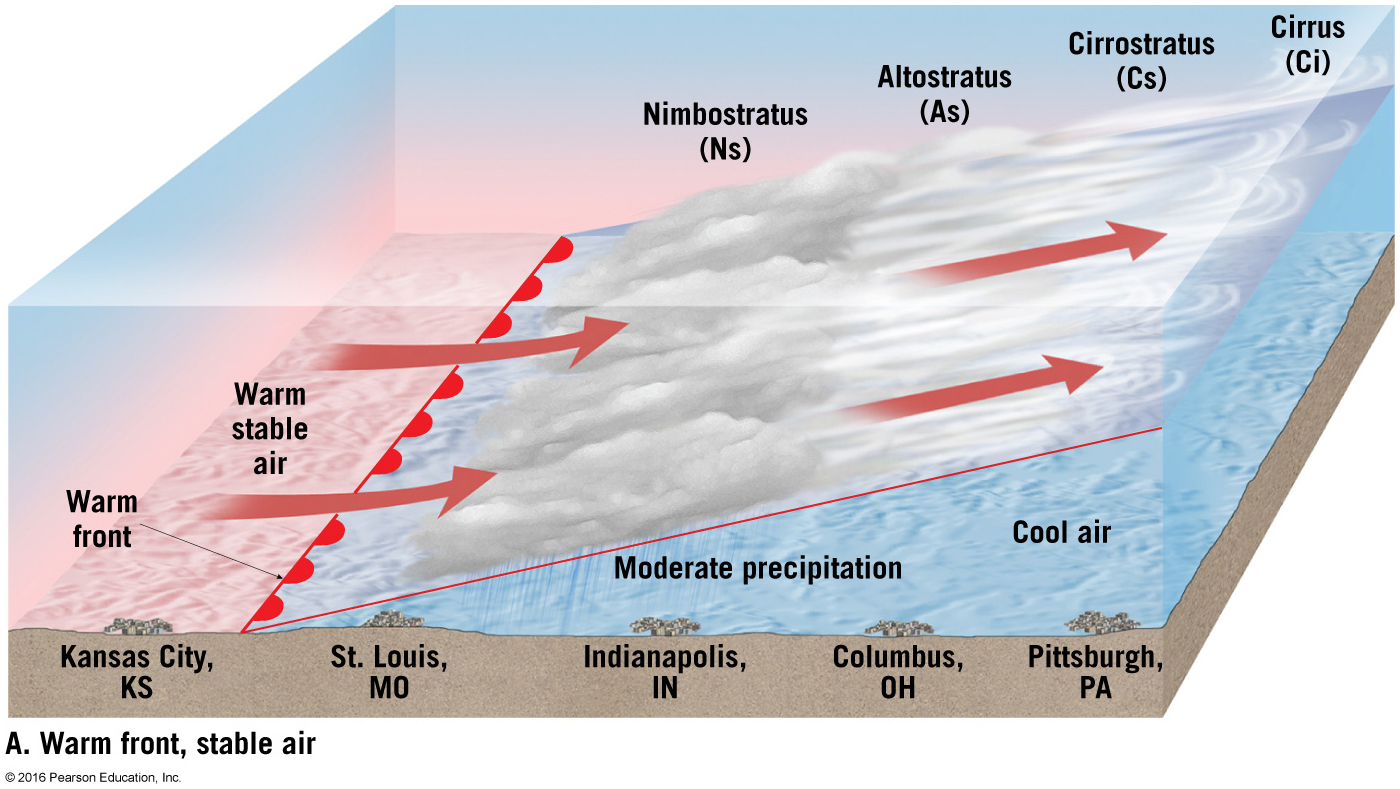
(1) warm
front,which
occurs when the surface (ground) position of a front moves so that warm air
occupies territory formerly covered by cooler air
(2) cold
front,where
cold continental polar air actively advances into a region occupied by warm
air,
(3) stationary
front,
which occurs when the air flow on both sides of a front is neither toward the
cold air mass nor toward the warm air mass,
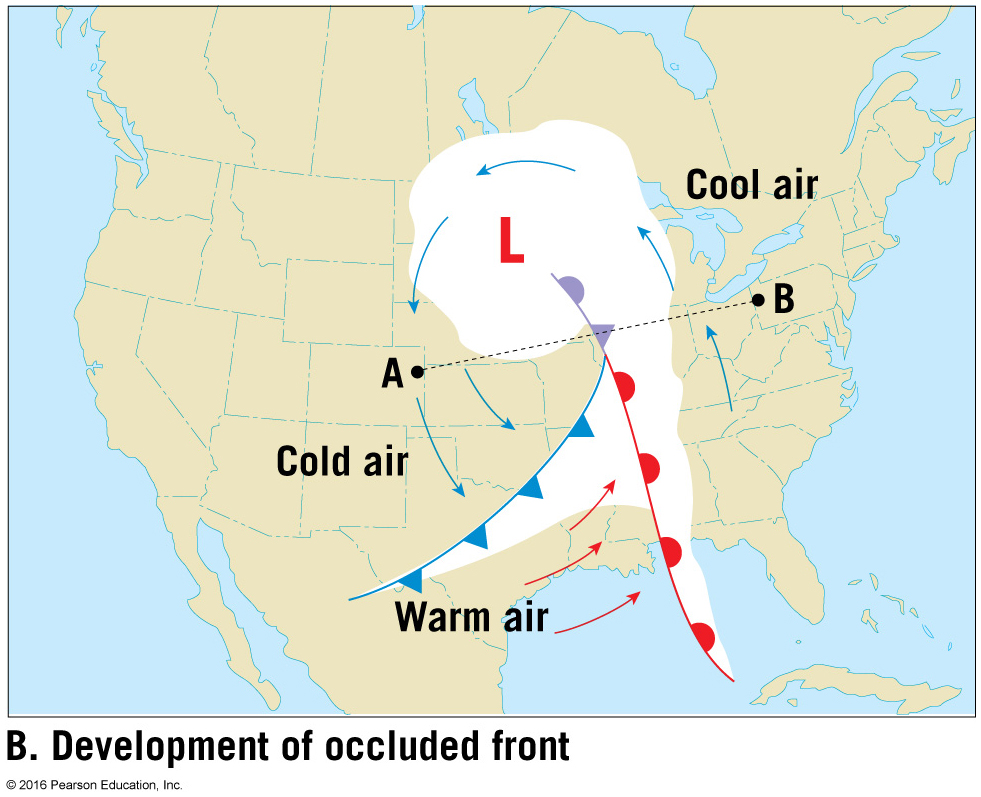
(4) occluded
front,which
develops when an active cold front overtakes a warm front and wedges the warm
front upward, the two types of occluded
fronts are the cold-type occluded front, where the air behind the cold front
is colder than the cool air it is overtaking, and the warm-type occluded front,
where the air behind the advancing cold front is warmer than the cold air it
overtakes.
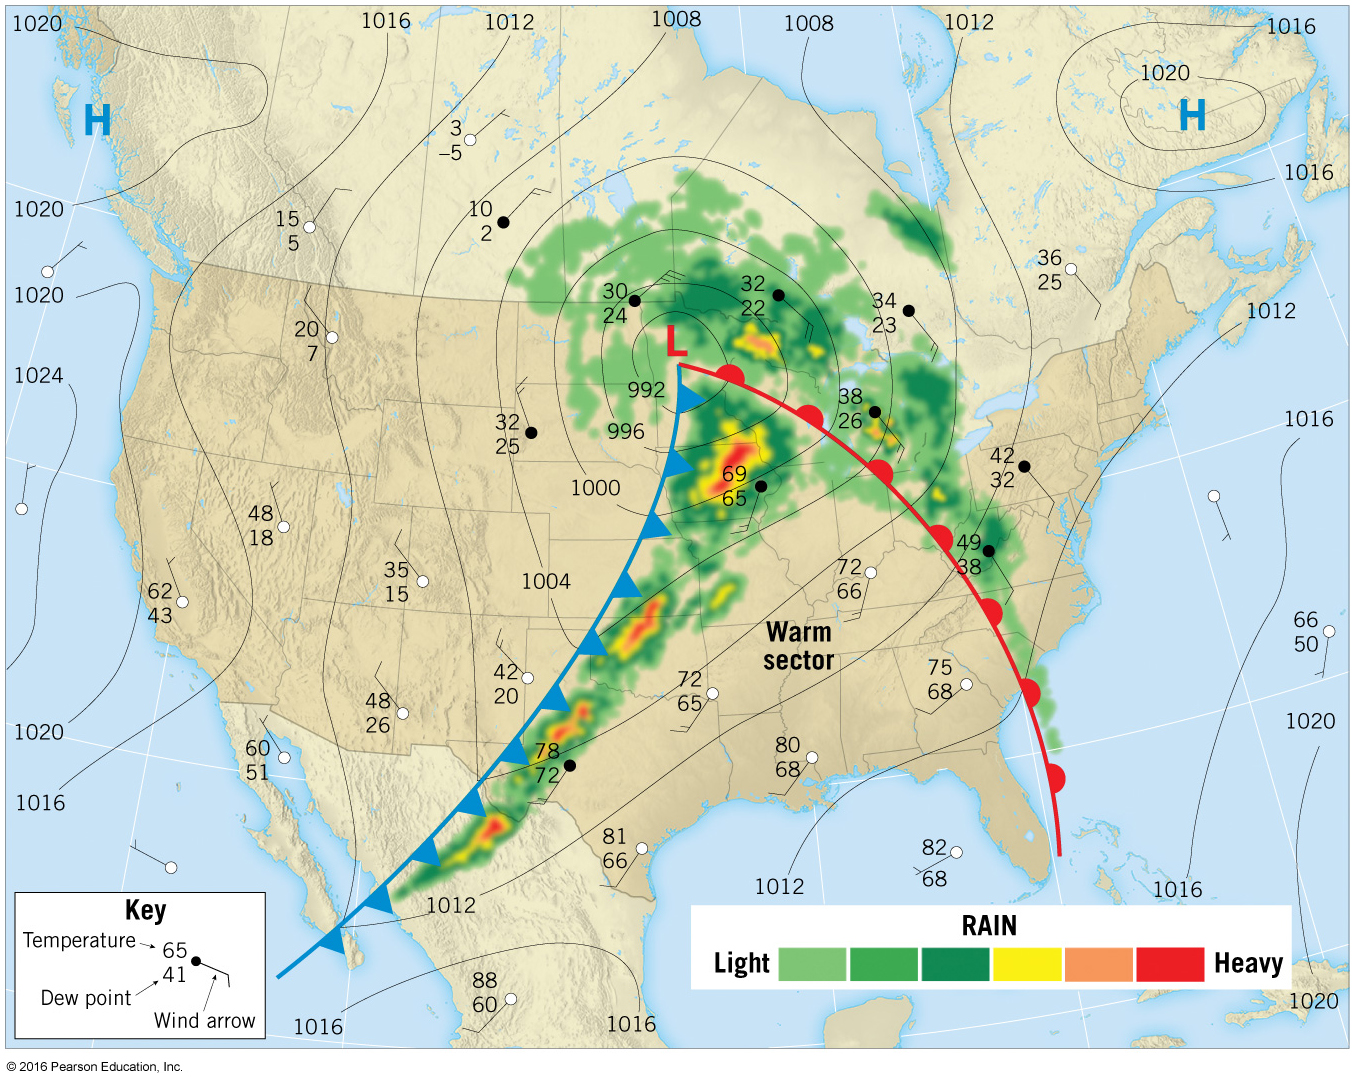
(5) a
dryline,a
boundary between dry, dense air and less dense humid air often associated with
severe thunderstorms during the spring and summer. Example would be temperatures in the 80s and 90s with dew points in the 60s and 70s on one side of the dry line, and temperatures in and 80s, 90s with dew points in the 30s, 40s and 50s. The lower the dew point the less moisture the air can hold.
VERY IMPORTANT!!!!!!*****If you miss an exam - your final exam grade will replace the missed exam!!!!! --- PLEASE WATCH ALL VIDEOS -----------
CLASS VIDEOS ON FRONTS
VERY IMPORTANT!!!!!!*****FOCUS ON 5 TYPES OF FRONTS -- WHAT HAPPENS AROUND THE FONTS?
WHAT ARE THE WINDS, AIR MASS, CLOUDS , PRESSURE , HUMIDTY. ETC ETC..-- WHAT TYPE OF PRECIPITATION, IF ANY..CAN IT SNOW? THUNDERSTORMS? SLEET OR FREEZING RAIN?
IS THE PRESSURE RISING OR FALLING.
CHAPTER 9 - PART 1
CHAPTER 9 -- PART 2
VIDEOS ON FRONTS AND AIR MASSES--
In addition to High and Low centers, you may see one or more of the following
eight features on a surface analysis or forecast. The definitions provided below are derived from the National Weather Service Glossary.
Cold Front - a zone separating two air masses,
of which the cooler, denser mass is advancing and replacing the warmer.
Warm Front - a transition zone between a mass of warm air and the cold air it is replacing.
Stationary Front - a front between warm and cold air masses
that is moving very slowly or not at all.
Occluded Front - a composite of two fronts, formed as a
cold front overtakes a warm or quasi-stationary front. Two types of occlusions can form
depending on the relative coldness of the air behind the cold front to the air ahead
of the warm or stationary front. A cold occlusion results when the coldest air is behind
the cold front and a warm occlusion results when the coldest air is ahead of the warm front.
Trough - an elongated area of relatively low atmospheric
pressure; the opposite of a ridge. On WPC's surface analyses, this feature is also used to depict
outflow boundaries.
Squall Line - a line of active thunderstorms, either continuous
or with breaks, including contiguous precipitation areas resulting from the existence of the thunderstorms.
Dry Line - a boundary separating moist and dry air masses. It
typically lies north-south across the central and southern high Plains states during the spring and early
summer, where it separates moist air from the Gulf of Mexico (to the east) and dry desert air from the
southwestern states (to the west).
Tropical Wave - a trough or cyclonic curvature maximum in the trade
wind easterlies.
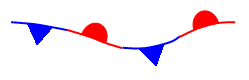
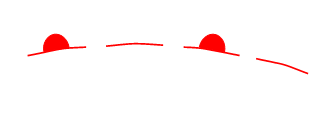
Depiction of frontogenesis and frontolysis
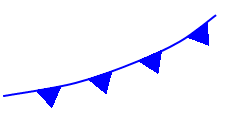
Frontogenesis refers to the initial formation of a surface front
or frontal zone, while frontolysis is the dissipation or weakening of a front. Frontogenesis is depicted
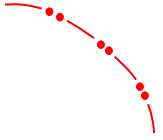
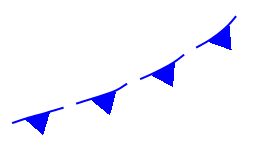
on WPC's surface analysis and forecast charts as a dashed line with the
graphical representation of the developing frontal type (the blue triangle for cold fronts, the red semicircle
for warm fronts, etc...)
drawn on each segment.
For example, the image below shows a forming cold front.
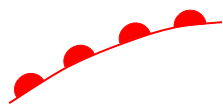
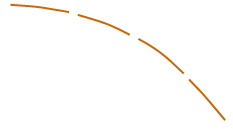
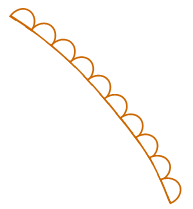
Frontolysis is depicted as a dashed line with the graphical
representation of the weakening
frontal type drawn on every other segment. Below is an example of a dissipating
warm front.
Wind Direction is always the direction the wind is coming from,
Middle Latitude Cyclone
primary weather producer
large Low pressure system, travels west to east
lasts a few days to more than a week
counter-clockwise rotation, net flow inward
cold front and sometimes warm front extend from center
cloud development, precipitation
Middle Latitude Cyclone - Weather Conditions
VERY IMPORTANT!!!!!!*****FOCUS ON 5 TYPES OF FRONTS -- WHAT HAPPENS AROUND THE FONTS ?
WHAT ARE THE WINDS, AIR MASS, CLOUDS? -- WHAT TYPE OF PRECIPITATION, IF ANY..CAN IT SNOW? THUNDERSTORMS? SLEET OR FREEZING RAIN?
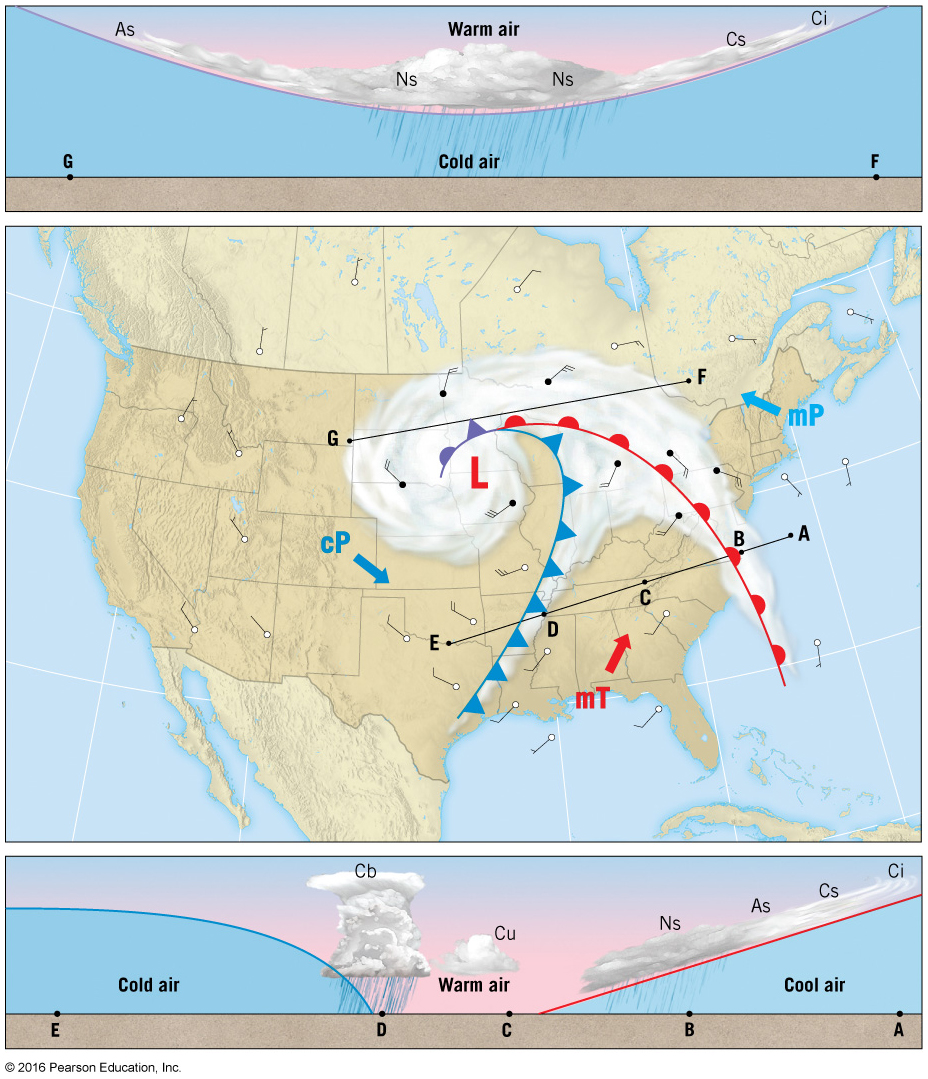
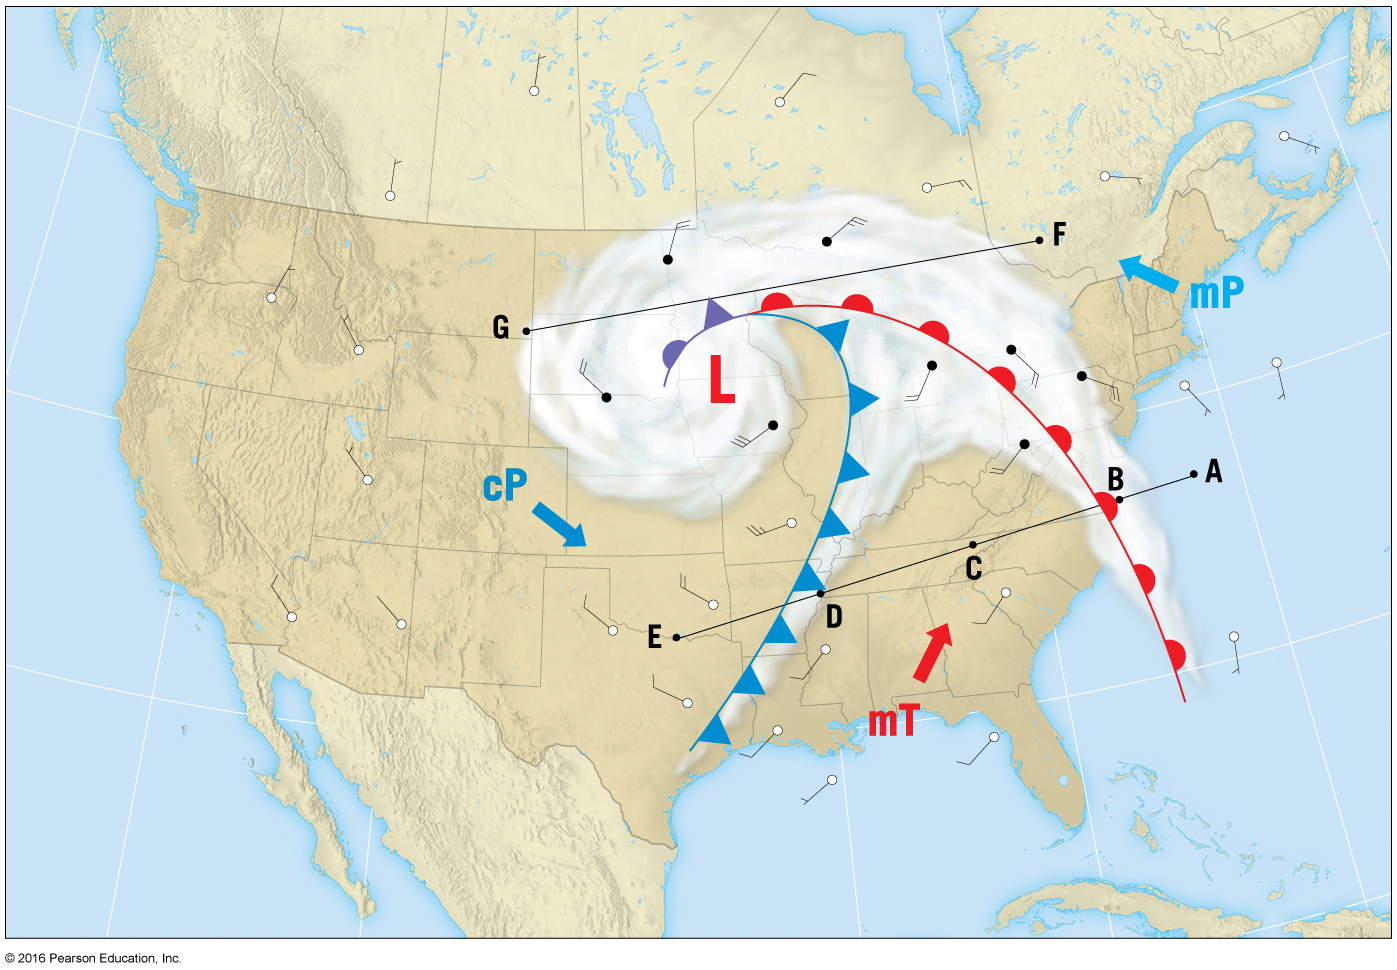
****IMPORTANT***** below and pages 241 to 243
A Falling pressure, high cirrus clouds. Clouds lower and thicken as warm front
approaches.
B As front nears, precipitation increases, temperature rises, and winds change
from E to SE.
C S winds, warm temperatures, clearing skies or fair weather cumulus.
D Gusty winds, precipitation along cold front. Possibly severe weather, thunderstorms.
Winds change from SW to NW, N.
E Rising pressure, cooler dry air, clearing skies as high pressure builds in.
F-G Temps remain cool, continual drop in pressure, increasingly overcast. This
area often generates snow storms in winter.
VERY IMPORTANT!!!!!!*****FOCUS ON 5 TYPES OF FRONTS -- WHAT HAPPENS AROUND THE FONTS.
WHAT ARE THE WINDS, AIR MASS, CLOUDS? -- WHAT TYPE OF PRECIPITATION, IF ANY..CAN IT SNOW? THUNDERSTORMS? SLEET OR FREEZING RAIN?
TEST 4 - WEDNESDAY MAY 7TH-
Cold Fronts
Before Passing
While Passing
After Passing
Winds
south-southwest
gusty; shifting
west-northwest
Temperature
warm
sudden drop
steadily dropping
Pressure
falling steadily
minimum, then sharp rise
rising steadily
Clouds
increasing: Ci, Cs and Cb
Cb
Cu
Precipitation
short period of showers
heavy rains, sometimes with
hail, thunder and lightning
showers then clearing
Visibility
fair to poor in haze
poor, followed by improving
good, except in showers
Dew Point
high; remains steady
sharp drop
lowering
Warm Front
Before Passing
While Passing
After Passing
Winds
south-southeast
variable
south-southwest
Temperature
cool-cold, slow warming
steady rise
warmer, then steady
Pressure
usually falling
leveling off
slight rise, followed by fall
Clouds
in this order: Ci, Cs, As, Ns, St, and fog;
occasionally Cb in summer
stratus-type
clearing with scattered Sc; occasionally
Cb in summer
Precipitation
light-to-moderate rain, snow, sleet, or drizzle
drizzle or none
usually none, sometimes light rain or showers
Visibility
poor
poor, but improving
fair in haze
Dew Point
steady rise
steady
rise, then steady
According to the polar front model, cyclones form along fronts and proceed
through a generally predictable life cycle. Along the polar front, where two
air masses of different densities are moving parallel to the front and in opposite
directions, cyclogenesis (cyclone formation) occurs and the frontal surface
takes on a wave shape that is usually several hundred kilometers long. Once
a wave forms, warm air advances poleward invading the area formerly occupied
by colder air. This change in the direction of the surface flow causes a readjustment
in the pressure that results in almost circular isobars, with the low pressure
centered at the apex of the wave. Usually, the position of the cold front advances
faster than the warm front and gradually closes the warm sector and lifts the
warm front. This process, known as occlusion, creates an occluded front. Eventually,
all the warm sector is forced aloft, and cold air surrounds the cyclone at low
levels. At this point, the cyclone has exhausted its source of energy, and the
once highly organized counterclockwise flow ceases to exist.
Guided by the westerlies aloft, cyclones generally move eastward across the
United States. As an idealized midlatitude cyclone moves over a region, the
passage of a warm front places the area under the influence of a maritime tropical
air mass and its generally warm temperatures, southerly winds, and clear skies.
The passage of a cold front is easily detected by a wind shift, the replacement
of a south or southwesterly airflow with winds from the west or northwest. There
is also a pronounced drop in temperature. A passing occluded front is often
associated with cool, overcast conditions, and snow or glaze during the cool
months.
Airflow aloft (divergence and convergence) plays an important role in maintaining
cyclonic and anticyclonic circulation. In a cyclone, divergence aloft does not
involve the outward flow of air in all directions. Instead, the winds flow generally
from west to east, along sweeping curves. Also, at high altitudes, speed variations
within the jet stream cause air to converge in areas where the velocity slows,
and to diverge where air is accelerating. In addition to speed divergence, directional
divergence (the horizontal spreading of an air stream) and vorticity (the amount
of rotation exhibited by a mass of moving air) also contribute to divergence
(or convergence) aloft.
Intensifying
Surface Cyclone:
For example, if a region of diverging winds at upper levels is stronger than
the converging winds of a suface low pressure center below it, the low will
deepen (intensify). This is because more air is being removed from the vertical
column of air above the low than flowing into it, causing the pressure at the
surface to decrease. A drop in pressure means an intensification of the low
pressure center.
Weakening
Surface Cyclone:
In contrast, if a region of diverging winds at upper levels is weaker than the
converging winds of a suface low pressure center below it, the low begins to
fill (weaken). This is because more air is flowing into the vertical column
of air above the low than flowing out of it, causing the pressure at the surface
to increase. An increase in pressure means a weakening of the low pressure center.
During the colder months, when the temperature gradients are steepest, cyclonic
storms advance at their greatest rate. Furthermore, the westerly airflow aloft
tends to steer these developing pressure systems in a general west-to-east direction.
Cyclones that influence western North America originate over the Pacific Ocean.
Although most Pacific storms do not cross the Rockies intact, many redevelop
on the lee (eastern) side of these mountains. Some cyclones that affect the
United States form over the Great Plains and are associated with an influx of
maritime tropical air from the Gulf of Mexico. Another area where cyclogenesis
occurs is east of the southern Appalachians. These cyclones tend to migrate
toward the northeast, impacting the eastern seaboard.
Due to the gradual subsidence within them, anticyclones generally produce clear
skies and calm conditions. One to three times each winter, large highs, called
blocking highs, persist over the middle latitudes and deflect the nearly zonal
west-to-east flow poleward. These stagnant anticyclones block the eastward migration
of cyclones, keeping one section of the nation dry for a week or more while
another region experiences one cyclonic storm after another. Also due to subsidence,
large stagnant anticyclones can produce a temperature inversion that contributes
to air pollution episodes.
In the spring, Earth's pronounced north-south temperature gradient can generate
intense cyclonic storms. At a midlatitude location, as a spring cyclone with
its associated fronts passes, temperatures can change quickly from unseasonably
warm to unseasonably cold, and thunderstorms with hail can be followed by snow
showers.
PHY116 CLASSES STOP HERE
STOP HERE FOR TEST 4
STOP HERE FOR TEST 4
STOP HERE FOR TEST 4
STOP HERE FOR TEST 4
YOU DID NOT NEED TO KNOW THE BELOW INFORMATION..
-------------------------------------------------------------------------------------------------------------------------------------------------------------------------------------------
A weather symbol is plotted if at the time of observation, there
is either precipitation occurring or a condition causing reduced visibility.
Below is a list of the most common weather symbols:
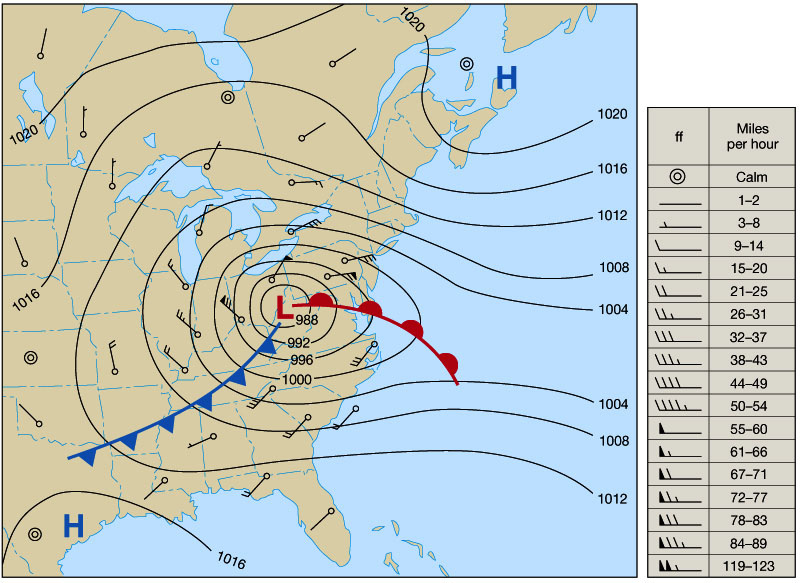
WIND
Wind is plotted in increments of 5 knots (kts), with the outer end of
the symbol pointing toward the direction from which the wind is blowing. The wind speed
is determined by adding up the total of flags, lines, and half-lines, each of which
have the following individual values:
Flag: 50 kts
Line: 10 kts
Half-Line: 5 kts
If there is only a circle depicted over the station with no wind symbol present, the wind is calm.
Below are some sample wind symbols:
PRESSURE
Sea-level pressure is plotted in tenths of millibars (mb), with the leading 10 or 9 omitted. For reference,
1013 mb is equivalent to 29.92 inches of mercury. Below are some sample conversions between plotted and
complete sea-level pressure values:
The pressure trend has two components, a number and symbol, to indicate how the
sea-level pressure has changed during the past three hours. The number provides the 3-hour change
in tenths of millibars, while the symbol provides a graphic illustration of how this change
occurred. Below are the meanings of the pressure trend symbols:
SKY COVER
The amount that the circle at the center of the station plot is filled in reflects
the approximate amount that the sky is covered with clouds. Below are the common cloud cover
depictions:
In addition to High and Low centers, you may see one or more of the following
eight features on a surface analysis or forecast. The definitions provided below are derived from the
National Weather Service Glossary.
Cold Front - a zone separating two air masses,
of which the cooler, denser mass is advancing and replacing the warmer.
Warm Front
- a transition zone between a mass of warm air and the cold air it is replacing.
Stationary Front - a front between warm and cold air masses
that is moving very slowly or not at all.
Occluded Front - a composite of two fronts, formed as a
cold front overtakes a warm or quasi-stationary front. Two types of occlusions can form
depending on the relative coldness of the air behind the cold front to the air ahead
of the warm or stationary front. A cold occlusion results when the coldest air is behind
the cold front and a warm occlusion results when the coldest air is ahead of the warm front.
Trough - an elongated area of relatively low atmospheric
pressure; the opposite of a ridge. On WPC's surface analyses, this feature is also used to depict
outflow boundaries.
Squall Line - a line of active thunderstorms, either continuous
or with breaks, including contiguous precipitation areas resulting from the existence of the thunderstorms.
Dry Line - a boundary separating moist and dry air masses. It
typically lies north-south across the central and southern high Plains states during the spring and early
summer, where it separates moist air from the Gulf of Mexico (to the east) and dry desert air from the
southwestern states (to the west).
Tropical Wave - a trough or cyclonic curvature maximum in the trade
wind easterlies.
Depiction of frontogenesis and frontolysis
Frontogenesis refers to the initial formation of a surface front
or frontal zone, while frontolysis is the dissipation or weakening of a front. Frontogenesis is depicted
on WPC's surface analysis and forecast charts as a dashed line with the
graphical representation of the developing frontal type (the blue triangle for cold fronts, the red semicircle
for warm fronts, etc...)
drawn on each segment.
For example, the image below shows a forming cold front.
Frontolysis is depicted as a dashed line with the graphical
representation of the weakening
frontal type drawn on every other segment. Below is an example of a dissipating
warm front.
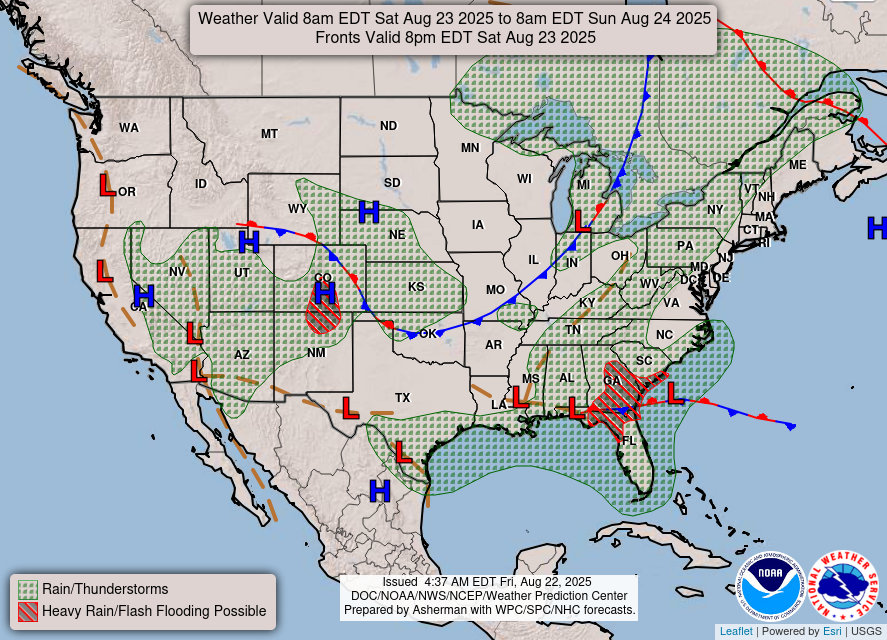
Precipitation Areas and Symbols
Areas of precipitation expected at the valid time of the forecast are outlined in green.
Shading within these lines, or lack of shading, indicates the expected coverage (not intensity) of precipitation.
Examples:
Note that on the full color forecast graphics with the terrain background, the above dashed line is blue.
(View an example)
Below are symbols found on our short range forecasts that represent categories (and in some cases intensities) of precipitation.
In forecast areas where the form of the precipitation is expected to vary, two symbols will be depicted and separated by a slash (/).
For instance, rain showers and thundershowers are often combined in regions where convection is forecast.


 pages 241 to 243
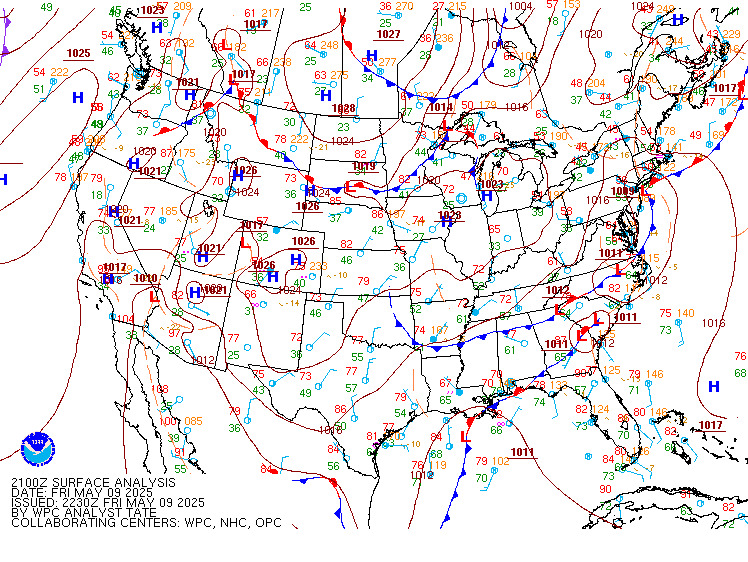 CURRENT WEATHER MAP


![[contours only]](http://www.hpc.ncep.noaa.gov/qpf/94qwbg.gif)
![[contours only]](http://www.hpc.ncep.noaa.gov/qpf/91ewbg.gif)
![[contours only]](http://www.hpc.ncep.noaa.gov/qpf/92ewbg.gif)
![[contours only]](http://www.hpc.ncep.noaa.gov/qpf/93ewbg.gif)
![[contours only]](http://www.hpc.ncep.noaa.gov/qpf/9eewbg.gif)
![[contours only]](http://www.hpc.ncep.noaa.gov/qpf/9fewbg.gif)