


Chapters 3, 4 and 5
Open Test 2 Review
Chapter 4 Videos
The Hydrologic Cycle & States of Water
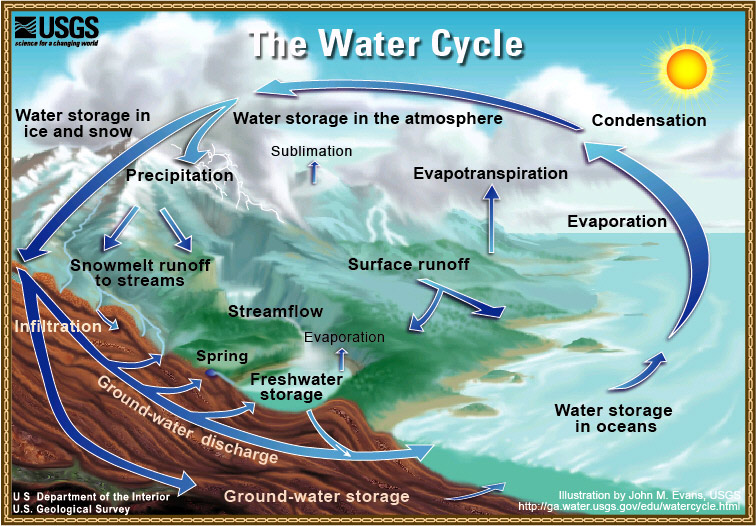
The hydrologic cycle, or water cycle, is the continuous circulation of Earth's water from the oceans to the atmosphere, from the atmosphere to the land, and from the land back to the sea.
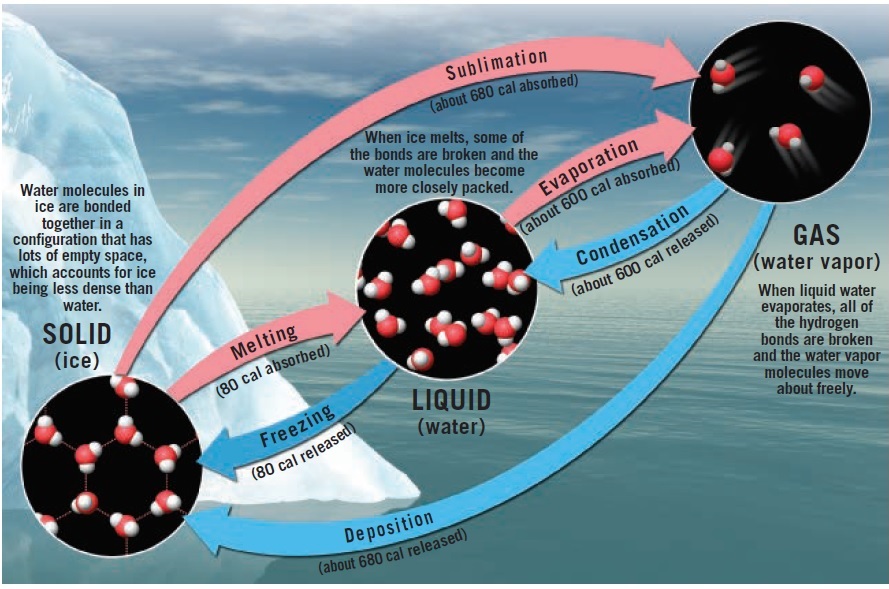
Water can exist as a solid, liquid or gas.
Changes of state include:
- Evaporation
- Condensation
- Melting
- Freezing
- Sublimation
- Deposition
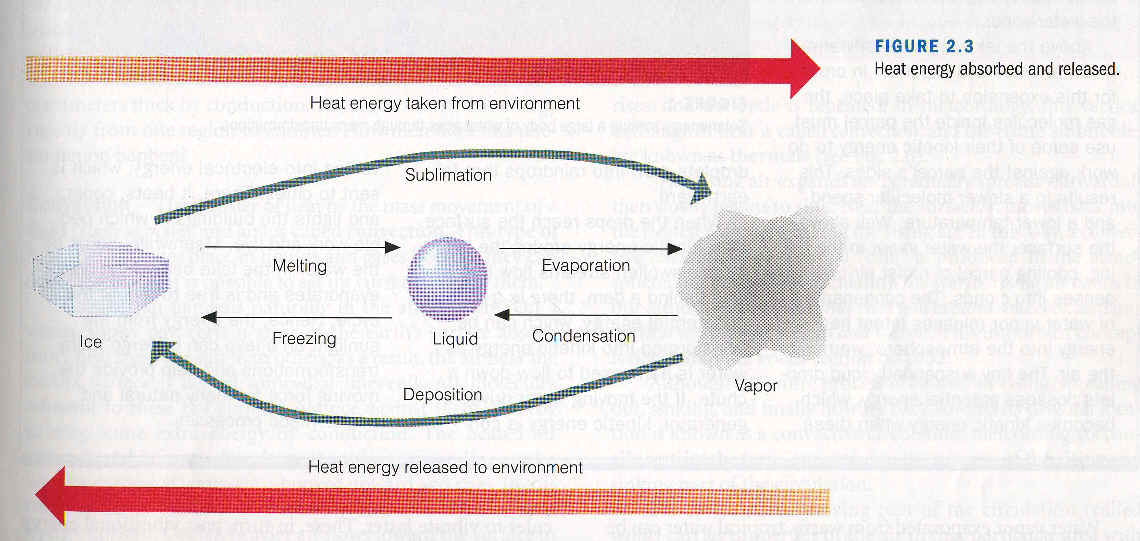
Latent heat is absorbed or released as water changes from one state to another.
Know the states of water, the names of the phase changes, and the calorie/latent heat values discussed in class.
Additional Videos
Humidity, Relative Humidity & Dew Point
Humidity describes water vapor in the atmosphere.
Relative Humidity
Relative humidity compares the amount of water vapor actually in the air with the amount required for saturation at that temperature.
Relative humidity can change when the amount of moisture changes or when the air temperature changes.
Dew Point
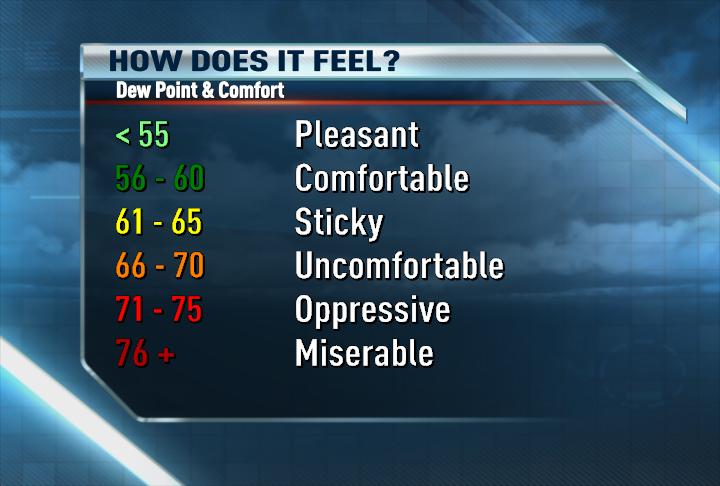
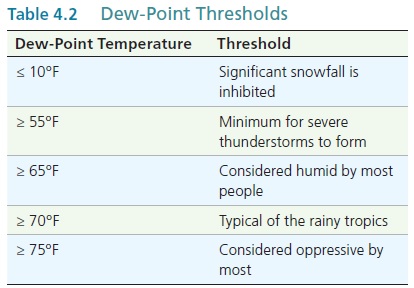
The dew point is the temperature to which air must be cooled for saturation to occur.
Unlike relative humidity, dew point is an indicator of the actual moisture content of the air.
Measuring Humidity
Instruments that measure humidity are called hygrometers.
A psychrometer uses a dry-bulb thermometer and a wet-bulb thermometer. The difference between the two temperatures can be used to determine relative humidity.
Adiabatic Temperature Changes
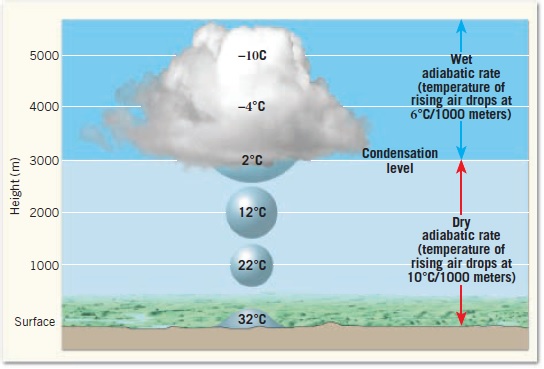
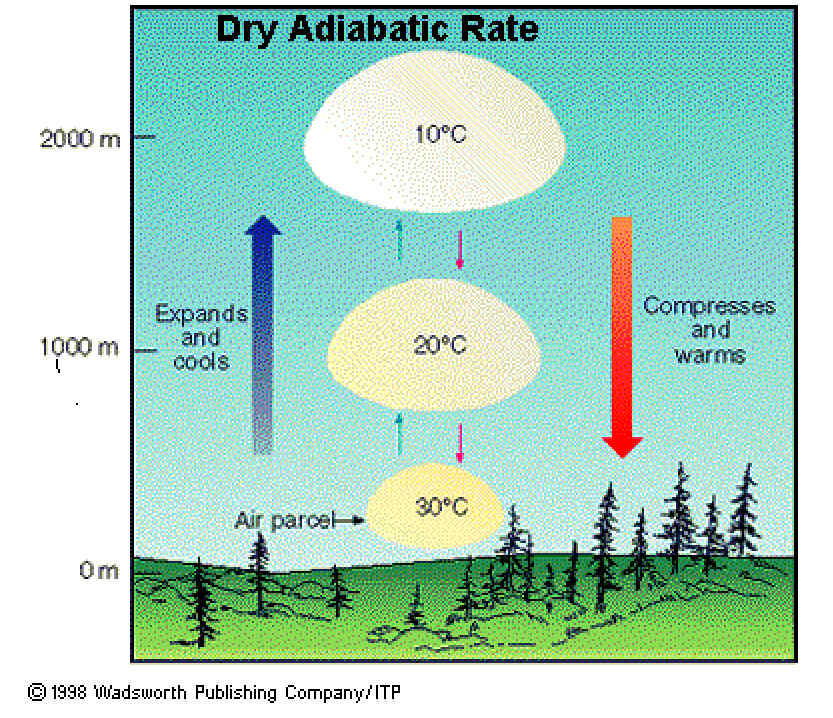
As air rises, atmospheric pressure decreases. The rising parcel expands and cools.
As air sinks, pressure increases. The sinking parcel is compressed and warms.
Temperature changes caused by expansion or compression, without heat being added or removed, are called adiabatic temperature changes.
Dry Adiabatic Rate
Used for an unsaturated air parcel.
Wet Adiabatic Rate
This is the value used in this class for a saturated air parcel.
Environmental Lapse Rate
The environmental lapse rate is the actual change of atmospheric temperature with height.
It is not constant.
The altitude where a rising air parcel reaches saturation. This is generally where cloud formation begins.
Four Mechanisms That Cause Air to Rise
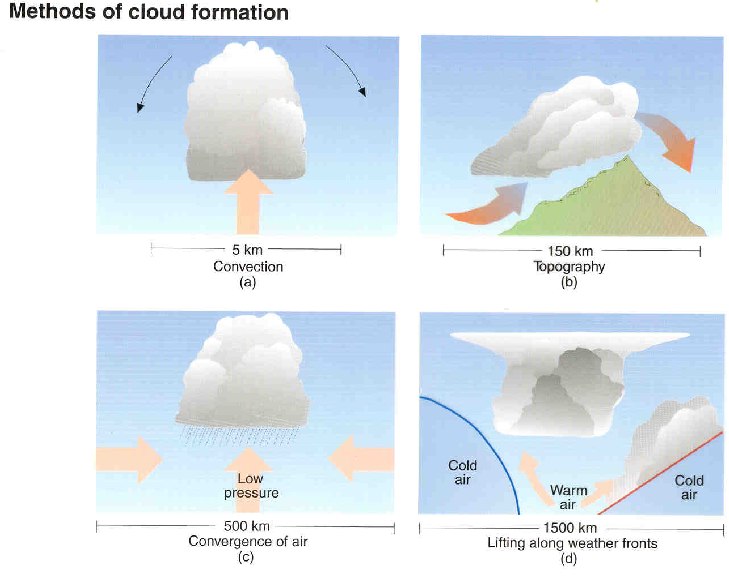
1. Orographic Lifting
Air is forced to rise over an elevated landform, such as a mountain.
2. Frontal Wedging
Warmer, less-dense air is forced to rise over cooler, denser air along a front.
3. Convergence
Horizontal airflow comes together and produces upward motion.
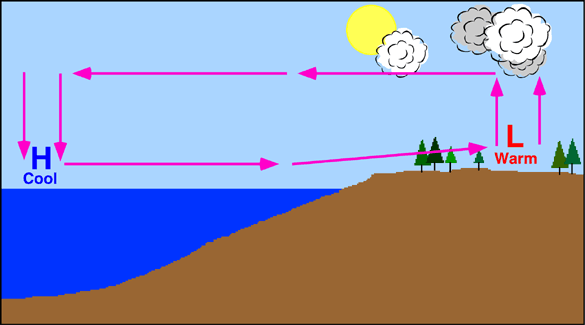
4. Localized Convective Lifting
Unequal heating of Earth's surface creates buoyant pockets of warm air that rise.
Atmospheric Stability
Stable air resists vertical movement.
Unstable air favors continued vertical motion.
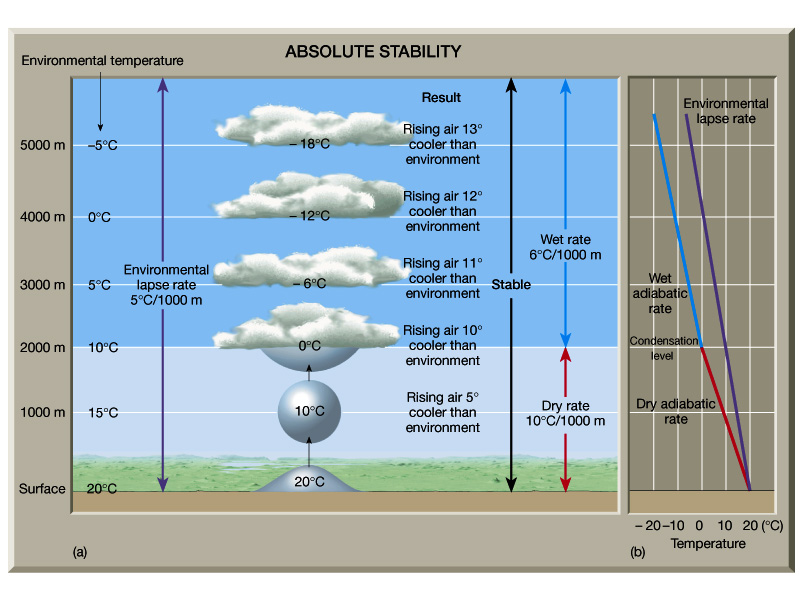
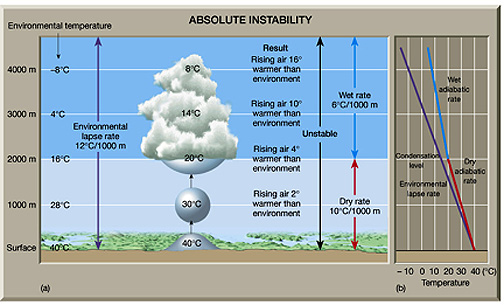
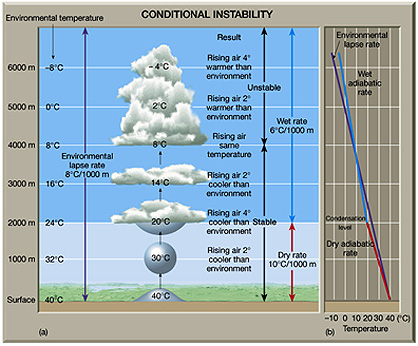
Atmospheric stability can be determined by comparing the environmental lapse rate with the dry and wet adiabatic rates.
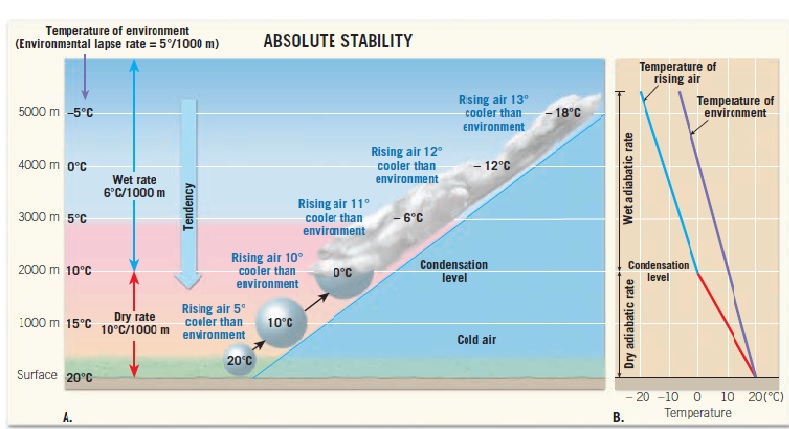
Absolute Stability
The environmental lapse rate is less than the wet adiabatic rate.
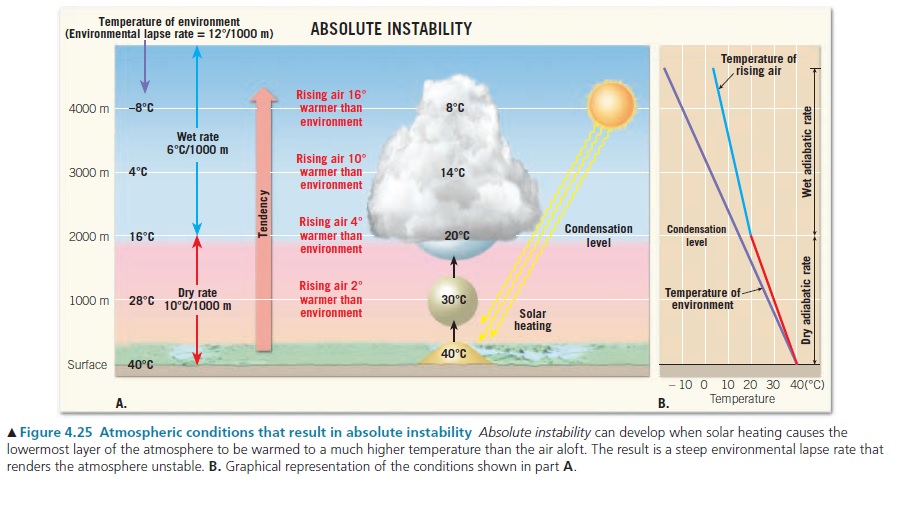
Absolute Instability
The environmental lapse rate is greater than the dry adiabatic rate.
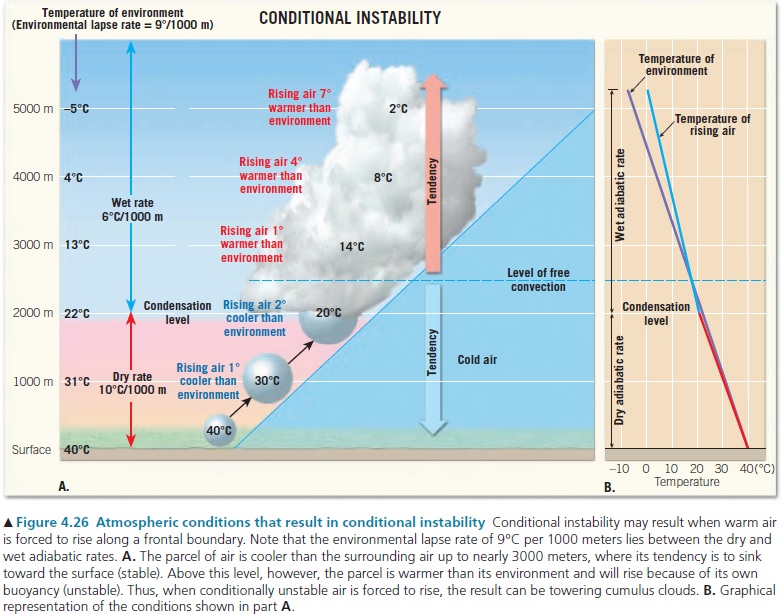
Conditional Instability
The environmental lapse rate is between the wet and dry adiabatic rates.
An unsaturated parcel may initially be stable, but after saturation it can become unstable.
Stability Graphics
Stability Videos
Stability Examples — Know These for Test 2
Dry Adiabatic Rate = 10°C/km
Wet Adiabatic Rate = 6°C/km
Example 1
ELR = 5°C/km
ABSOLUTE STABILITY
Example 2
ELR = 12°C/km
ABSOLUTE INSTABILITY
Example 3
ELR = 9°C/km
CONDITIONAL INSTABILITY
Quick Rules
- If the environmental lapse rate is less than the wet adiabatic rate, the atmosphere is stable.
- If the environmental lapse rate is greater than the dry adiabatic rate, the atmosphere is unstable.
- An air parcel that is warmer than its environment is positively buoyant and tends to rise.
- An air parcel that is colder than its environment is negatively buoyant and tends to sink.
Review Figures 4.24, 4.25 and 4.26.
Pay special attention to the figures on Pages 102–103.
Soundings & Upper-Air Analysis
Radiosondes provide vertical profiles of atmospheric temperature and moisture.
Meteorologists use sounding diagrams, including Skew-T diagrams, to examine atmospheric stability and other characteristics of the atmosphere.
NWS Sounding Examples NWS Severe Weather Soundings Current Upper-Air SoundingsChapters 3, 4 and 5
Review:
- States of water and phase changes
- Relative humidity and dew point
- Dry and wet adiabatic rates
- Environmental lapse rate
- Lifting Condensation Level
- Four lifting mechanisms
- Absolute stability
- Absolute instability
- Conditional instability
- The 5°C, 12°C and 9°C lapse-rate examples
- Pages 96–105 and Figures 4.24, 4.25 and 4.26